

Quick setup: Blnk Cloud
Requires Blnk Core 0.14.4 or later.
1
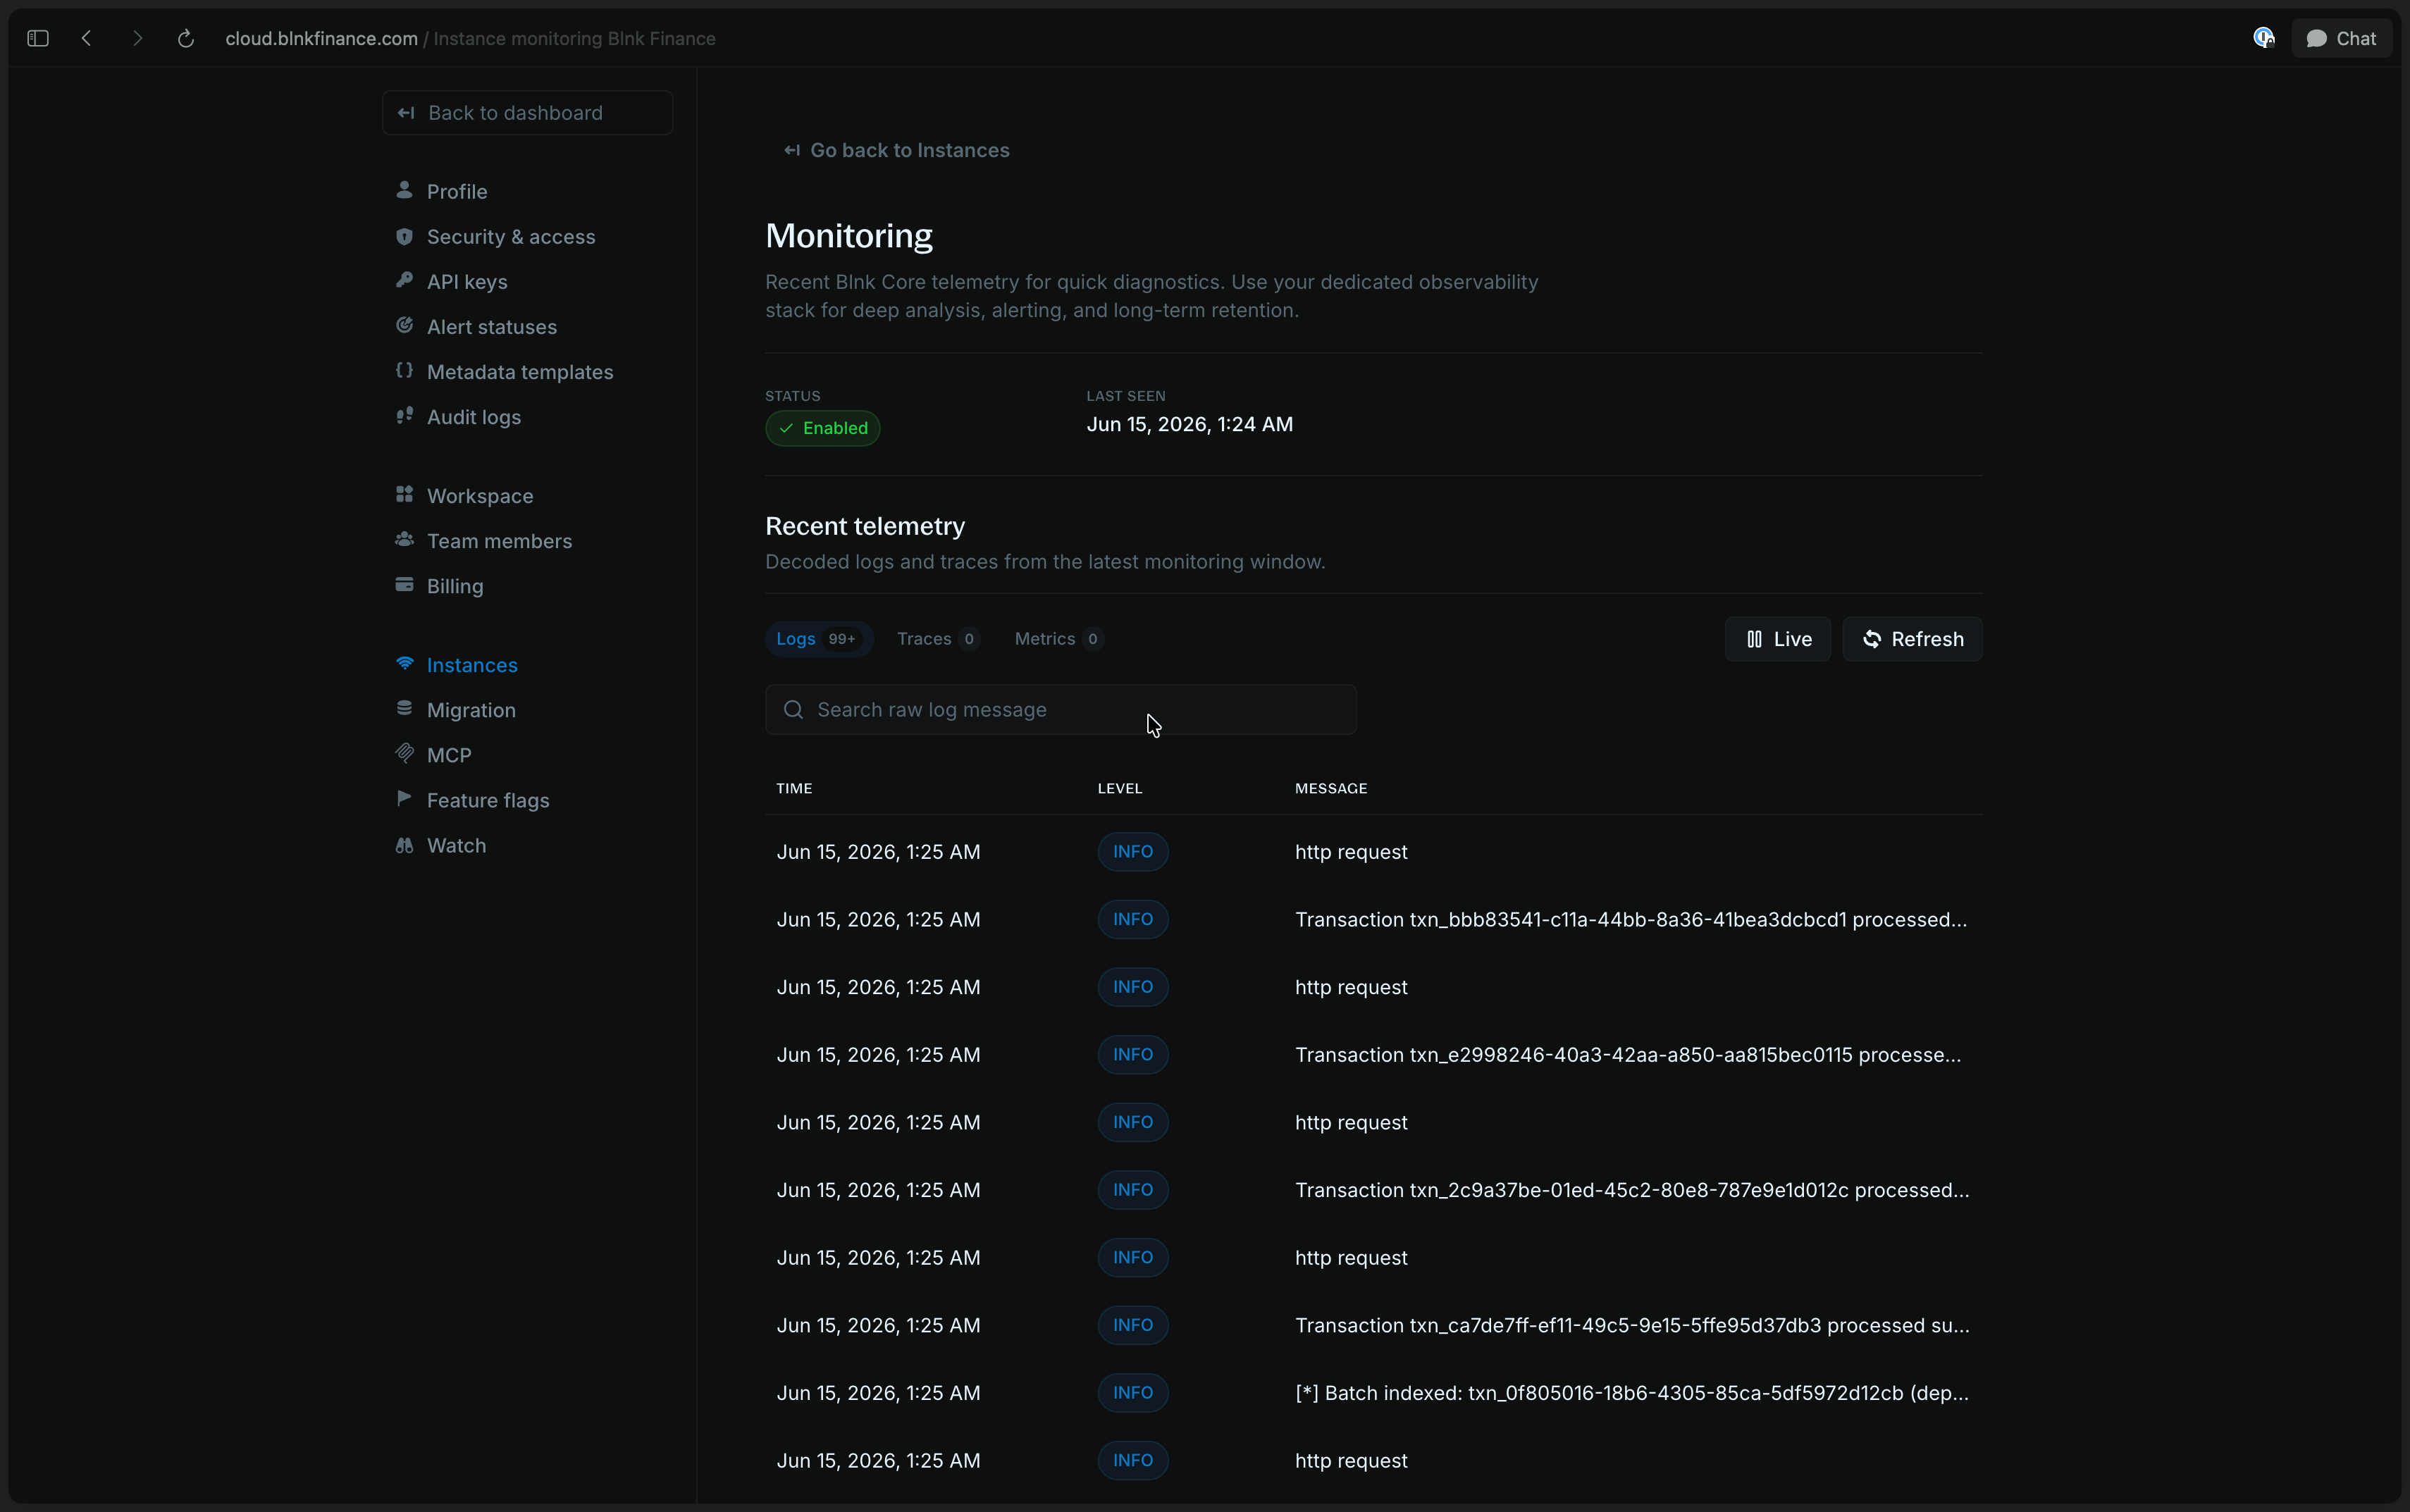
Sign in to Blnk Cloud
Open your Blnk Cloud workspace.
2
Connect your instance
If you have not already, connect your Core deployment to Cloud.For a self-hosted Core, follow Connect your self-hosted Core. For a managed instance, see Deploy a managed instance.
3
Enable monitoring and copy the DSN
Open the instance in Cloud, turn on monitoring in the instance settings, then copy the 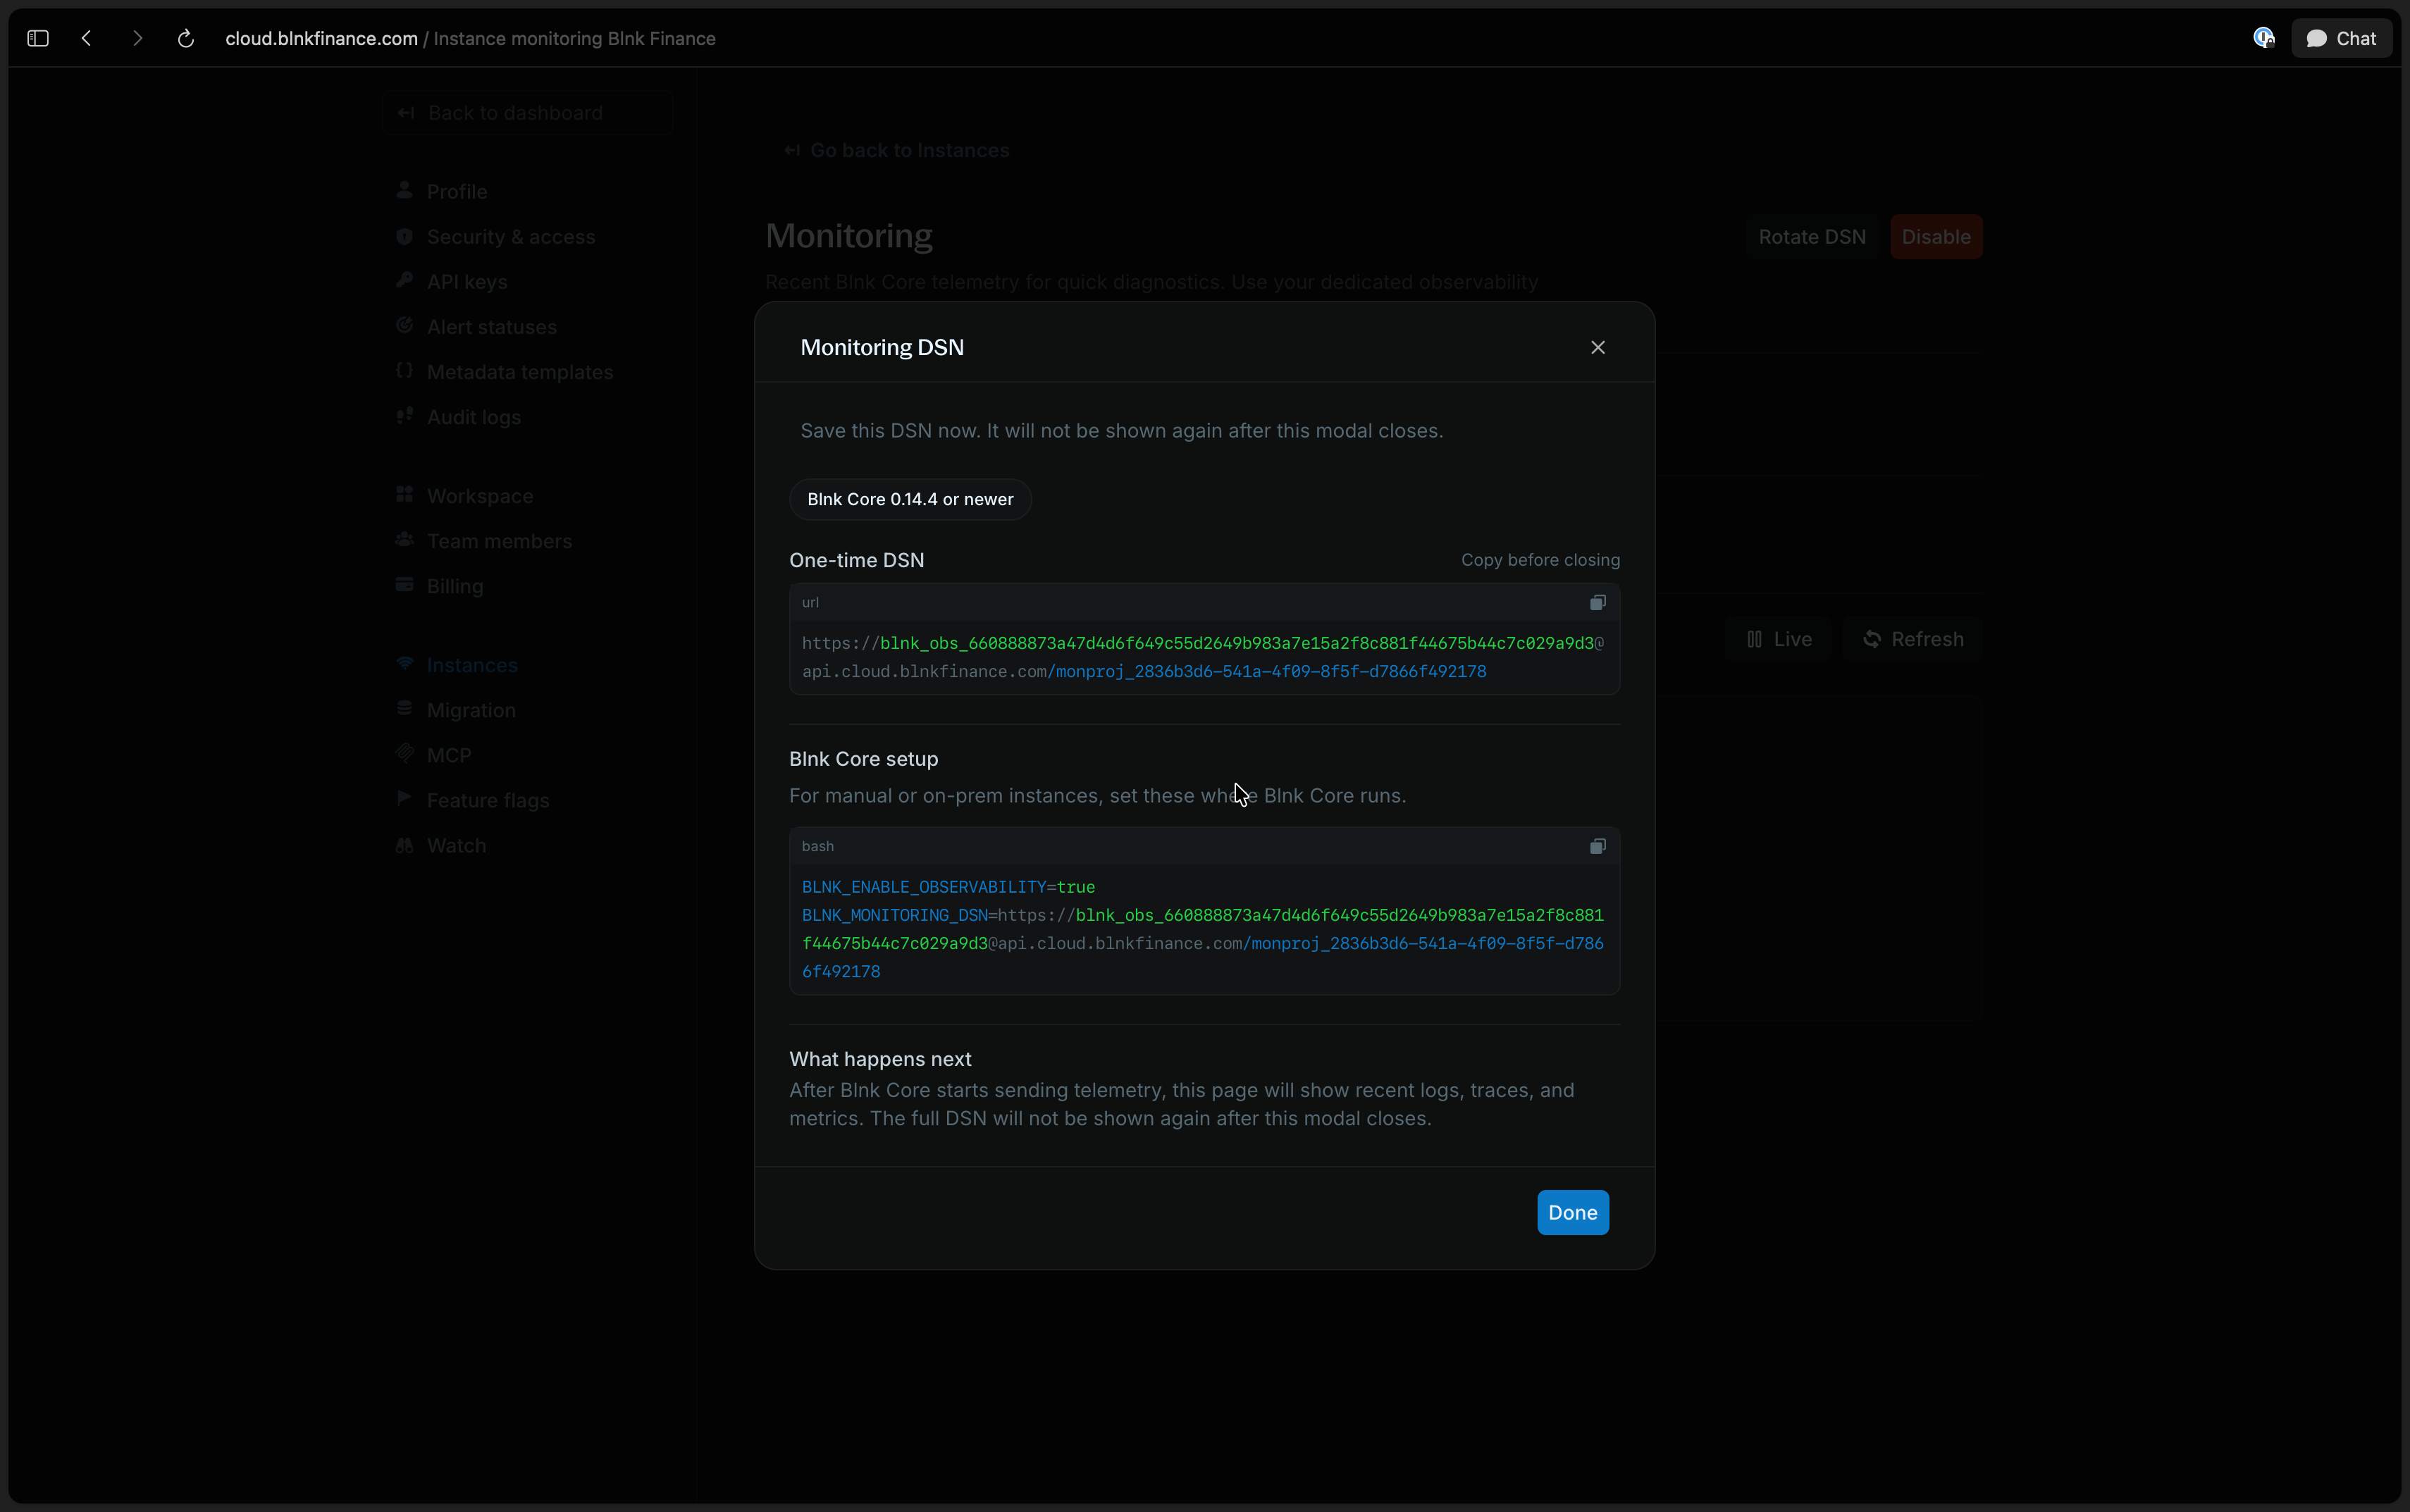
Blnk Cloud DSN.You will add it to your Core configuration in the next step.4
Set the Blnk Cloud DSN in your Core config
Turn on observability and add the Blnk Cloud DSN to your configuration file.Restart the server and worker processes after updating configuration.
5
Confirm data is flowing
Check server logs for a message that monitoring export is enabled, then open your Blnk Cloud monitoring workspace and confirm Blnk data is arriving.It may take a few minutes for the first data to show up.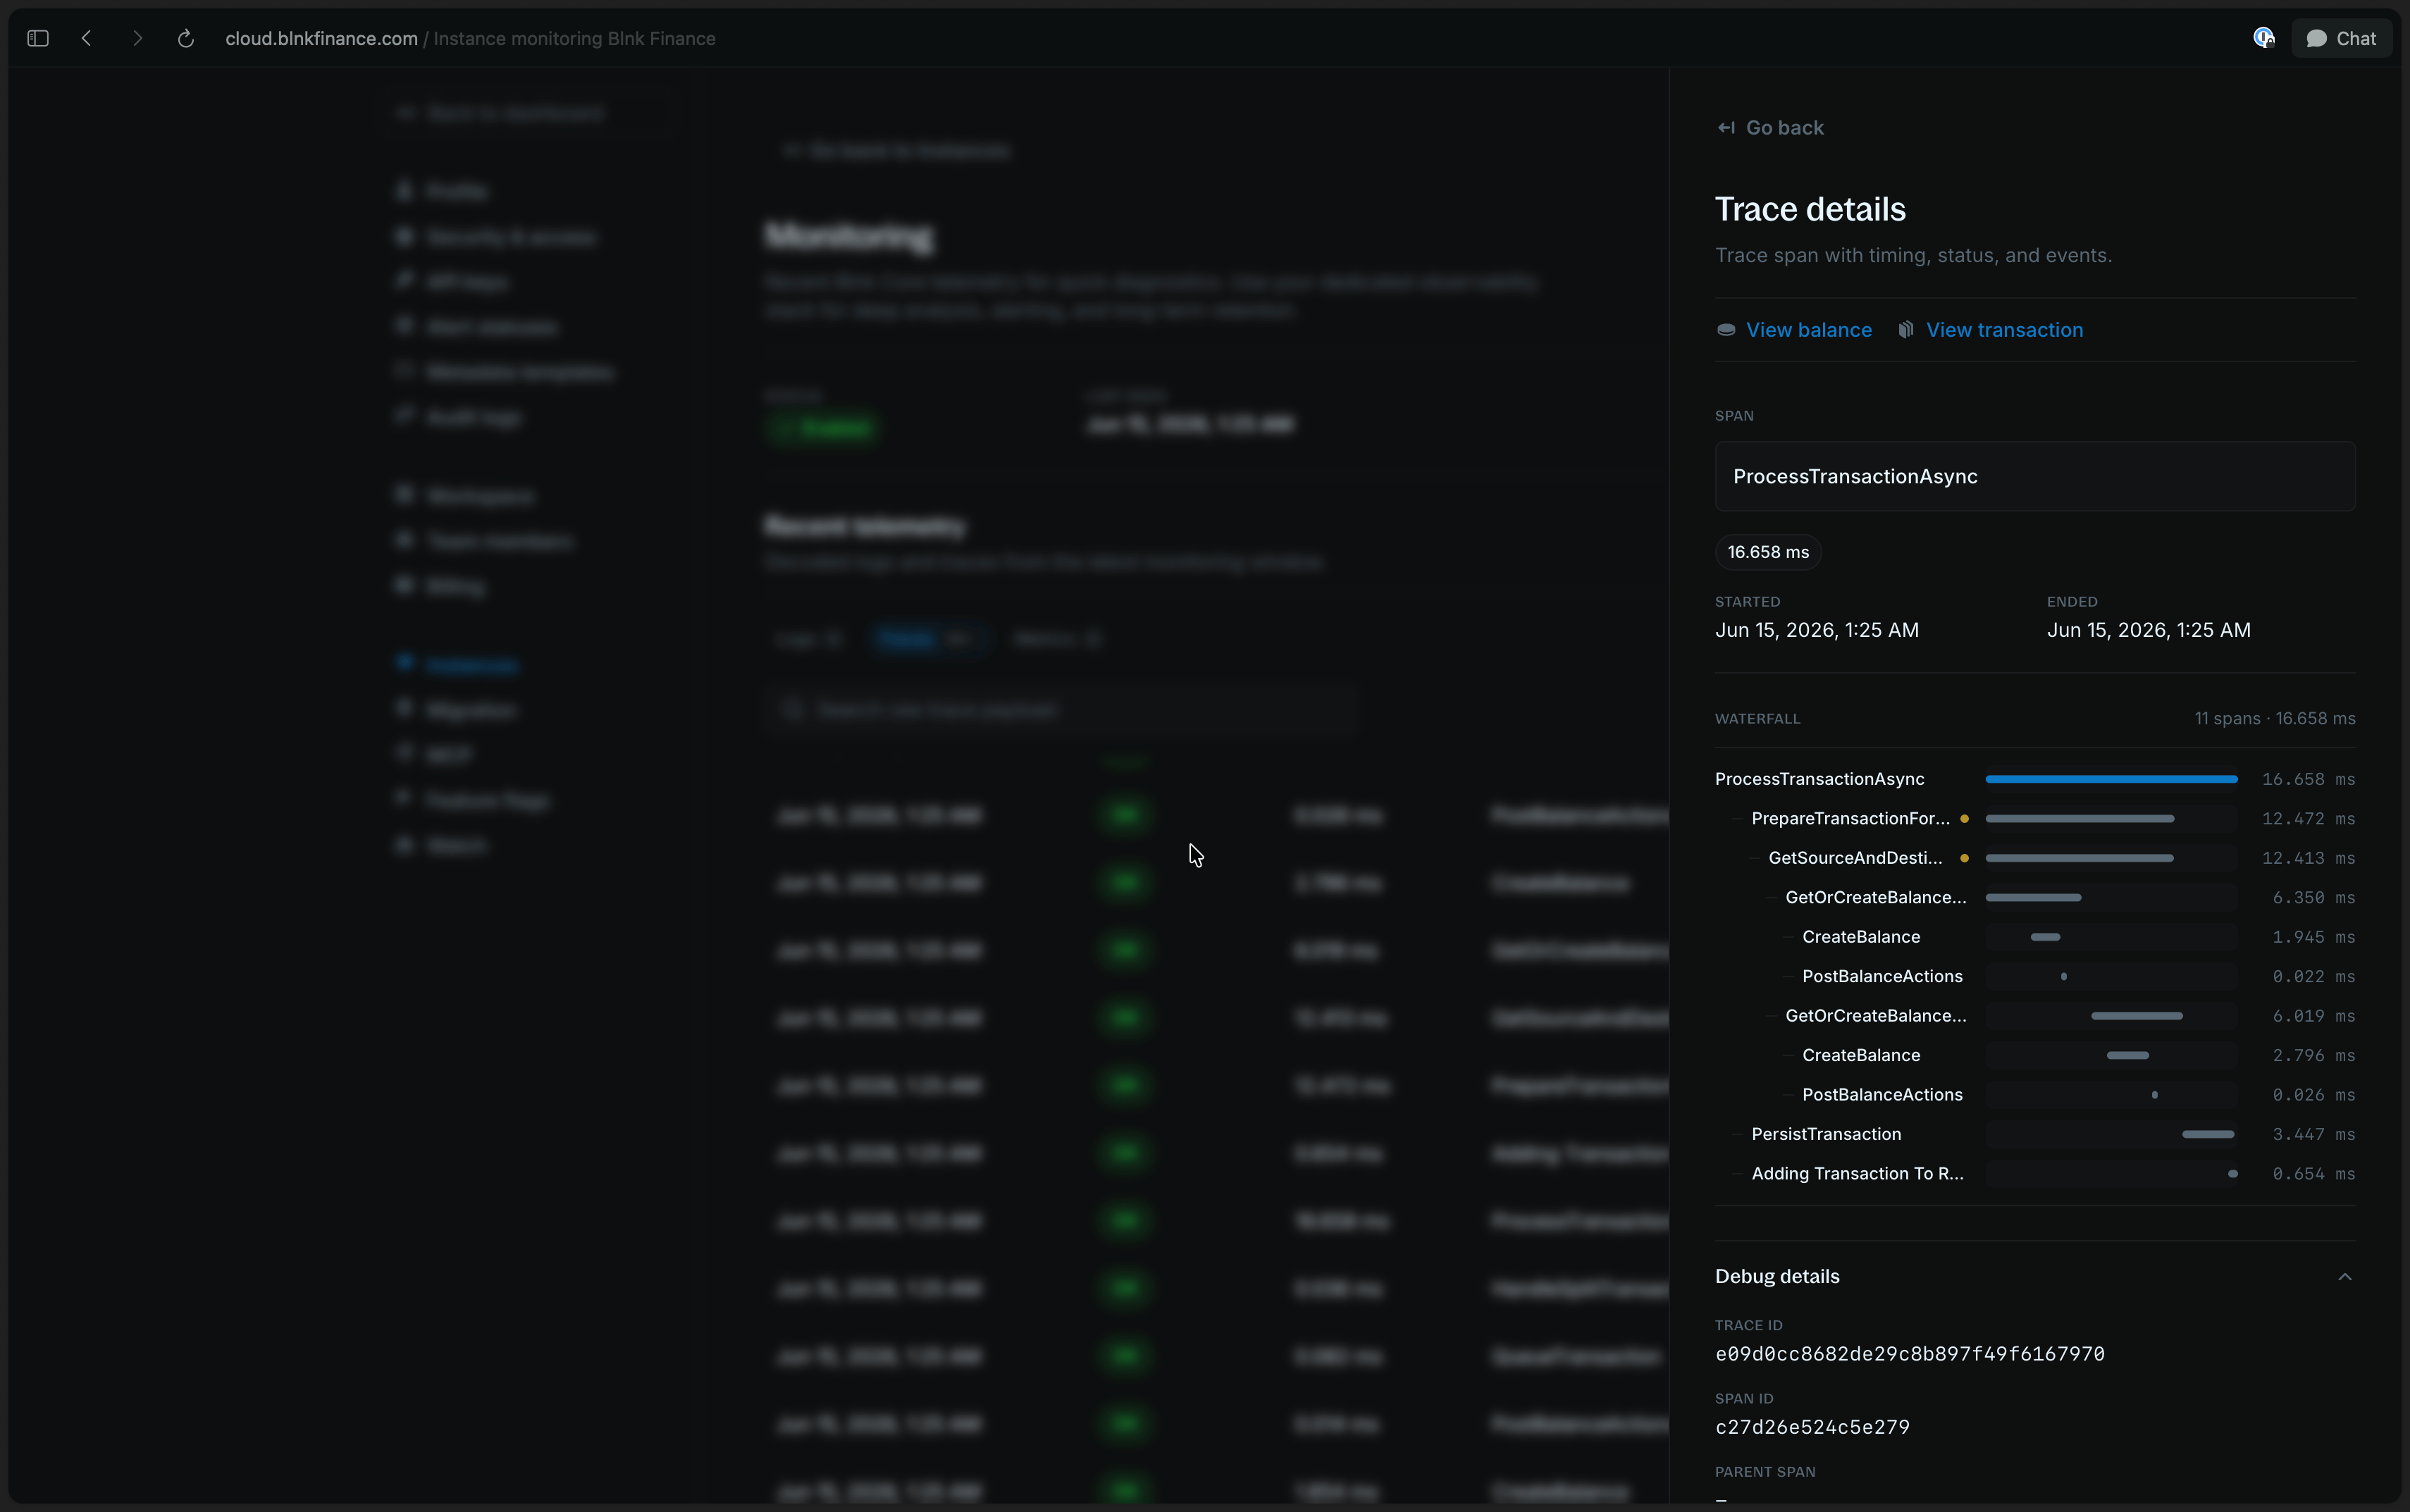
When you export to Blnk Cloud, sensitive values (such as tokens and connection strings) are removed before they leave your instance.
Connect to other tools
If your team already runs a dedicated observability stack, you can export Blnk logs, traces, and metrics to Jaeger, Prometheus, Grafana, OpenTelemetry Collector, Datadog, or any backend you operate. Blnk exposes traces and metrics via OpenTelemetry and Prometheus. Logs are written to process output; forward them with your log shipper.1
Enable observability in Core
Set Restart both processes after updating configuration.
BLNK_ENABLE_OBSERVABILITY=true on the server and workers.2
Export logs
Collect
stdout and stderr with your log agent or shipper and forward to any backend.3
Export traces
Set the traces OTLP HTTP endpoint in the environment for the server and worker. Jaeger, Grafana Tempo, and the OpenTelemetry Collector accept OTLP:After restart, call any API endpoint and confirm traces for service
blnk.env
BLNK appear in your backend (Jaeger UI defaults to port 16686).4
Export metrics
Blnk supports two export modes. Use one or both.
- Pull
- Push
Scrape Restart both processes after changing the token. Verify scrapes against each target:
GET /metrics from the server and worker. Targets depend on your setup:5
Confirm each signal
After restart and a test API call, verify monitoring export is working end to end. Server and worker logs should report that monitoring export is active.Probe metrics on both processes (omit the header when no bearer token is configured):Check traces in your OTLP backend and log lines in your log store.
Common Blnk scenarios
Match the symptom to the signal that answers it fastest. Start with the recommended signal, then drill into the others if you still need context.API feels slow
API feels slow
Start with: TracesOpen a trace for a slow request and compare step duration across the timeline. Look for time spent in database writes, queue enqueue, or external calls rather than assuming the API handler is the bottleneck.If traces are unavailable, check server logs for the request window and correlate with queue processing logs on the worker.
Transactions stuck in QUEUED
Transactions stuck in QUEUED
Start with: Logs and queue monitoringConfirm workers are running and processing jobs. In the queue dashboard, check depth and whether items are moving.In logs, look for worker startup messages, processing errors, or repeated retries on the same transaction. A healthy queue should show enqueue activity on the server and dequeue/processing activity on workers.
Ledger integrity or processing delay
Ledger integrity or processing delay
Start with: MetricsWatch background processing signals over time. Rising processing duration or falling throughput can mean hash-chain sealing or related integrity work is falling behind.Compare server and worker metrics together. Delay on the worker while the API looks healthy often points to queue backlog rather than API saturation.
Errors or 5xx spikes
Errors or 5xx spikes
Start with: Logs, then tracesFilter logs around the spike window and capture the error message and
transaction_id or request ID when present. That gives you the failure reason without opening a trace first.When you need timing context, open the trace for the same request and see which step returned the error or timed out.Rejection rate spike
Rejection rate spike
Start with: Metrics, then logsCheck rejection counters grouped by reason (for example insufficient funds, overdraft limit, lock contention). A sudden change in one reason usually narrows the investigation quickly.Use logs to find example rejected transactions and confirm whether the spike matches a product change, balance issue, or concurrency pattern.
Worker retries climbing
Worker retries climbing
Start with: Metrics and logsSustained worker retries often mean transactions are failing transiently or hitting lock contention. Compare retry rate with queue processing duration on the worker.In logs, search for retry messages on the worker and note the error text. Repeated retries on the same balance pair may indicate hot-lane or lock contention worth correlating with transaction volume.
Inflight commit or void not completing
Inflight commit or void not completing
Start with: Logs, then tracesFind the inflight transaction ID in logs and follow commit or void processing on the worker. Confirm the original inflight transaction exists and the follow-up request reached Core.If processing started but did not finish, use a trace on the commit or void request to see whether failure happened in validation, balance update, or queue handling.
After a deploy, latency or errors increased
After a deploy, latency or errors increased
Start with: Traces and metricsCompare request latency and error rate before and after the deploy window. Open traces for representative slow and failed requests in each window and note which step changed.Check that both server and worker were restarted with the same monitoring export and configuration changes. Mismatched config between processes is a common post-deploy regression.
Monitoring data not showing up
Monitoring data not showing up
Start with: LogsAfter restart, server logs should report that monitoring export is enabled. For Blnk Cloud, confirm monitoring is on in the instance settings and the Blnk Cloud DSN is set. For self-hosted export, confirm OTLP or scrape targets are configured on both server and worker.Cloud ingestion can take a few minutes for the first data. For self-hosted setups, send a test API request and check your trace backend, metrics scraper, and log store separately.
/metrics returns 404
/metrics returns 404
Monitoring export is disabled or the process was not restarted after enabling it.Set
enable_observability=true on the server and worker, then restart both processes./metrics returns 403
/metrics returns 403
Secure mode is on but
metrics_bearer_token is not set.Configure a bearer token and restart Core./metrics returns 401
/metrics returns 401
A bearer token is required but missing or invalid. Include
Authorization: Bearer <token> in scrape or curl requests.No traces in Jaeger
No traces in Jaeger
Blnk exports traces over OTLP HTTP.Confirm
OTEL_EXPORTER_OTLP_TRACES_ENDPOINT is set on both server and worker. Use port 4318 for OTLP HTTP, not gRPC port 4317.Queue dashboard works but metrics do not
Queue dashboard works but metrics do not
The queue dashboard is at
/monitoring on the worker port. Metrics are at /metrics on the server and worker ports. Monitoring export must be enabled for /metrics to be registered.Production health baseline
Production health baseline
Start with: MetricsEstablish normal ranges for resource use, transaction throughput, queue processing time, and rejection rate during steady traffic. Use those baselines for alerts rather than fixed thresholds copied from another environment.Confirm scrapes or Cloud ingestion succeed on a schedule so gaps in data do not look like an incident.